Preliminary Report
of Luminosity Monitoring for Experiment e89044 - Jefferson Lab
Experiment
3He(e,e'p)2H and 3He(e,e'p)pn
at a wide variety of beam energies and spectrometer settings. Measure cross
sections for ee'p.
When
Experiment was performed during December, 1999 and February
and March, 2000 in Hall A at Jefferson Laboratory.
Target
The target was 3He gas at pressures from 114psi
to 165psi at a temperature of 6.3K. The gas flows perpendicularly across
the rastered beam (2mmX4mm) along the axis of a "tuna can". A funneled
entrance at the bottom of the tuna can increases the target flow speed
in the beam interaction region.
Special Circumstances
1) Cross sections must be measured accurately enough to
perform separations.
2) At these pressures and temperatures the equation of
state of 3He is not known to better than about 7%.
3) Measurement of very low cross sections were done using
large beam currents ( up to 120uA). Beam heating effects on target density
were unknown for this target.
4) Compatible sets of cross sections to obtain the response
functions had to be measured at different beam energies and at different
times.
5) Luminosity Monitoring and a normalization scheme had
to be developed.
Items (1) and (2)
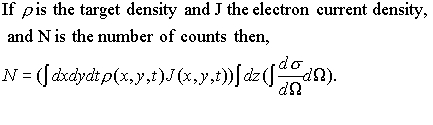
Definition of Luminosity Factor ( It is the first integral
below over target density and electron current density.)
We include the effect on the solid angle as a function
of the position "z" along the beam direction.
Current monitors in Hall A are accurate to the 1%-2%
level. We could deduce the densities by measuring elastic scattering at
low Q2 where elastic electron scattering is well know ( to within
1%). Q2 = -q2 , where q is
the four-momentum of the elastically scattered electron. The
luminosity factor, however, is given solely in terms of the measured number
of elastic events and the known cross section.
We considered counters as a means of doing the normalizations
but concluded that their response was not specific enough to the luminosity
to do the separations we aimed to do. The most accurate devices in Hall
A are the spectrometers. Trace back from the focal plane to the target
allowed us to select only events from the central region of the gas cell
(+- 2cm), which is 10cm long. Additional cuts on target angle variables
reduced background still more.
Item (3) Beam Heating Effects
At 842 MeV we took a dedicated series of runs to measure
the elastic count rate at Q2 = 5 F-2
versus the beam current.
The best straight line fit through these data give a slope
of ________________!!
However, at 1257 MeV from March 2000 there is no obvious
beam heating effect going from 2 uA to 100 uA using the hadron detector.
Item (4) Connecting data sets at different times and
beam conditions
Stability of the luminosity monitor
At 1257 MeV for a low beam current we observed a rather
large ( about 5% standard deviation) variation of the hadron counts
per mC at Q2 = 5 F-2 . Note - These data below
are taken over a total of 1 minutes. The corresponding electron data show
a 1.4% standard deviation. There is no clear reason why the hadron counter
should be so much worse. The lowest ponit in the graph was measured with
ps3=40, compared to ps3=4 for the other points.
At 4032 MeV we took a 24 hour run for obtaining the elastic
cross section at Q2 = 19 F-2 . The hadron counter
stability is displayed as a function of run number.
Stability of the hadron_counts/mC for selected runs .
These results are consistent with current monitoring
accuracy to about 1%.
| |
runs 1510-1544,
Dec'99
at 4032 MeV, 24 hours |
runs 1408-1415,
Dec'99
at 842 MeV, 7 hours |
runs 2624-2631,
Mar'00
at 1257 MeV, 8 hours |
runs 2557-2575,
Mar'00
at 644 MeV, 7.5hrs |
standard deviation in
hadron_cnts/mC |
0.7% |
0.9% |
0.8% |
1.3% |
| nominal current |
I = 5 uA |
I = 63 uA |
I = 98uA |
I = 1.3uA to 5 uA |
Transferring normalizations between spectrometers
The spectrometers were run in coincidence mode to obtain
the (ee'p) cross sections and in singles mode to do the normalizations
from one setting to the next. Normalizations were transferred from one
spectrometer to the other when both spectrometers had to be moved.
Connecting runs at different beam energies
For some high beam energies it was not possible to measure
elastic scattering at low enough Q2 that we could deduce directly
from known elastic cross sections the target density. Elastic cross sections
were specifically measured at low beam energies so that the higher Q2
data could be normalized to the lower Q2 data. This technique
effectively normalizes data sets at different energies by use of the charged
form factor of 3He.
Comparison of cross section results using pwba at Q2
= 5 /fm2. Target densities are determined by a comparison to
Otterman's calculation (Ott) or by the target gauges (g)
(modified Aug. 9, 2000)
| run # |
Ee MeV |
theta_e deg |
<sig_exp> cm2/sr |
<sig_mott> |
<sig_exp>/<sig_mott> |
| 2528 |
644 |
41.20 |
1.95e-32 (ott) |
2.699e-30 |
7.12e-3 |
| 2575 |
644 |
41.20 |
1.92e-32 (ott) |
2.699e-30 |
7.12e-3 |
| 1389 |
841.7 |
31.03 |
3.89e-32 (ott) |
5.07e-30 |
7.67e-3 |
| 2601 |
1257 |
20.56 |
8.48e-32 (ott) |
1.208e-29 |
7.02e-3 |
| 3034 |
1257 |
20.57 |
8.87e-32 (ott) |
1.208e-29 |
7.34e-3 |
| 2085 |
1956 |
13.05 |
2.28e-31 (g) |
3.088e-29 |
7.38e-3 |
Assuming sigma = sigma_mott*|F|2 , <|F|2|
= 7.28(0.24)e-3, i.e., 3.3% standard deviation
Comparison of cross section results at Q2
= 15/fm2 .
(Put in Frank's results)
A comparison at Q2 = 19/fm2
is underway. This factorization does not seem to work well from the preliminary
data. For example,
| run# |
E |
Q2 |
<sig_exp>/<sig_mott> |
| 1413 + |
841.7 |
19.38 |
2.14e-5 |
| 2630 + |
1257 |
19.06 |
1.20e-5 |
| 1543 + |
4032 |
19.32 |
to be done |