User name Templon
Log entry time 13:15:03 on October13,2000
Entry number 50304
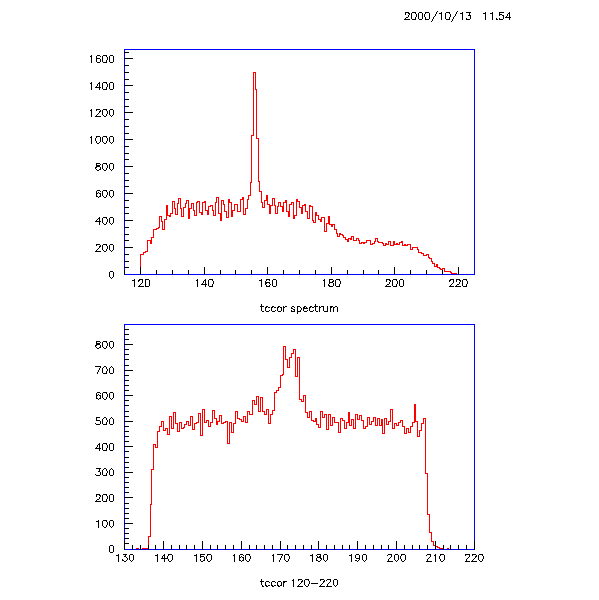
keyword=analysis of tc_cor plottc_cor looks funny ever since the coinc time window adjustment.
fig. 1 is a plot of tc_cor in run 1803 (py-2d). cuts applied:
abs(e.reactz)<0.1 abs(h.reactz)<0.1 plus good region of raw tc
the lower part of fig. 1 shows the corresponding plot of tc.
.
the second figure shows the raw tc spectrum, gated on each of four
25-ns wide regions of tc_cor. it is interesting that one can trace
the strange nature of tc_cor directly back to tc as follows: the reduction
in the "plateau" appears to be directly related to the width of "tc" accepted
by these equal-time tc_cor bins. For some reason the redistribution of
tc is not equal across the acceptance.
FIGURE 1

FIGURE 2
