Summer 2007 E89044 elastic analysis for undergraduate students
students:
Daniel Hernandez (DH), Edgardo Ramos (ER)
task summary:
Students will compare their assigned data sets to the corresponding geant calculation. They will adjust the geant spectrum by varying the spectrometer resolutions until the geant spectra full width at half maxiumu (FWHM) matches the data. This procedure will allow us to determine how much of the elastic peak is outside the integration area.

geant_in/geant_all = data_in/data_all.

Where geant_in is the geant area inside the peak window,  geant_all is the total geant area, and
data_in is the data inside the peak window and data_all is the total data, which we are seeking.

Students will use paw or paw++ to do this analysis with analysis codes provided by K. Aniol

Data q2 in 1/F^2 and energy in MeV
data files are in westwind under /data/aniol/e89044/analysis/q2_x/energy
geant runs are in westwind under  /data/aniol/3he-geant/geant-runs/3he-energy-q2-x.hbook.gz
All data spectra are 600 channels over 15 MeV, except for (E=4032,q2=19.37) which is 300 channels over 60 MeV
The table contains student's initial, spectrometer angle, and the energy range for the data spectra.
Students will analyze the geant data using the information in each cell.

Steps in analysis
(A) Inspecting the data files for good data
Our first task is to inspect the data files for each (q2, energy) combination. During the experiment the experimental set up was often held fixed but the data were collected for that particular condition over several runs. A run is a period of data taking identified by a run number. Each run is stored as a data file. Ideally the data in the different runs will agree substantially with each other as long as the spectrometer angle and momentum setting was fixed. However,
this is not always the case. We will want to add together the data from all the good runs. Good runs will be inspected visually and numerically using paw or paw++. We will use as an example identifying the good runs for q2=5, E=644. The data files will have the name epkin_run#.dat, where run# is the run number.

go to the directory of interest

cd /data/aniol/e898044/analysis/q2_5/644

list the directory contents

ls
analyze         he3_48.kumac   pe_2555.dat    phtg_2575.dat  ztgt_2552.dat
big.kumac       last.kumac     pe_2574.dat    thtg_2552.dat  ztgt_2553.dat
epkin_2552.dat  last.kumacold  pe_2575.dat    thtg_2553.dat  ztgt_2554.dat
epkin_2553.dat  nt48.f         phtg_2552.dat  thtg_2554.dat  ztgt_2555.dat
epkin_2554.dat  paw.metafile   phtg_2553.dat  thtg_2555.dat  ztgt_2574.dat
epkin_2555.dat  pe_2552.dat    phtg_2554.dat  thtg_2574.dat  ztgt_2575.dat
epkin_2574.dat  pe_2553.dat    phtg_2555.dat  thtg_2575.dat
epkin_2575.dat  pe_2554.dat    phtg_2574.dat  transfer
We are interested in all the files epkin_run#.dat. These are 600 channels long and the low and high energies are given in the big table below.
Using the composer function on the seamonkey browser create a web document and make a table. An example is given here.

Now run a session of paw or paw++.

[
aniol@westwind geant_cp_e89044]$ paw
 ******************************************************
 *                                                    *
 *            W E L C O M E    to   P A W             *
 *                                                    *
 *       Version 2.13/08      19 September 2002       *
 *                                                    *
 ******************************************************
 Workstation type (?=HELP) <CR>=1 :   (at this point hit enter and you get a graphics screen)
PAW > shell get_data 5 644 2552   (this loads the correct run for analysis)
PAW > exe plot
enter low channel (<CR>=) 597   (these low and hi channels come from the big table)
enter hi channel (<CR>=) 612
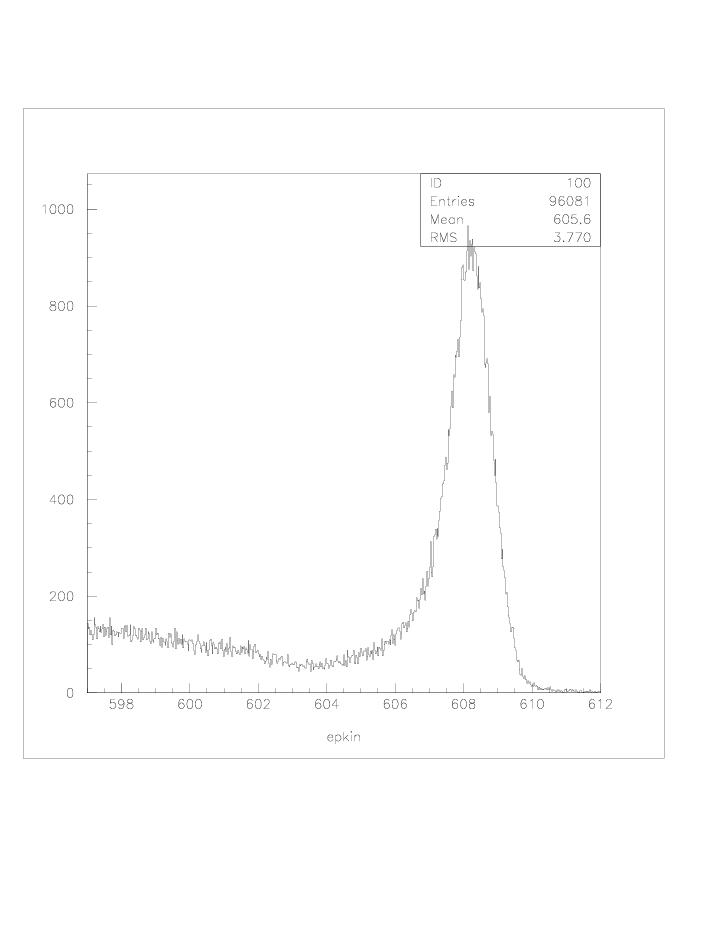
(The graphics screen will display the spectrum as shown below.)


(Record the mean value, 605.6, in your web readable document and go through all the runs. In this case 2552, 2553, 2554, 2555, 2574 and 2575.)
(All the spectra for this q2 and energy value should look similar and have means that are very close to each other but not necessarily identical.)

 We will add together the good spectra for each kinematic setting. The students will write the fortran programs to add the spectra together. Give the summed spectrum an easily identified name, for example, d_5_644.dat, where 'd' means data, '5' means q2=5 and '644' means 644 MeV. Also cp this data spectrum to a file called 'data.dat'.
cp d_5_644.dat data.dat .
You will be using data.dat in subsequent analyses in comparison to the monte carlo simulation from geant.

(B) To create the geant spectra
 For each (energy, q2) combination ( example is for energy = 644, q2 = 5)
(1) Find the correct energy and angle from the big table.

(2) Run the paw analysis program. Here is a sample session with my commands in bold and (comments are in italics).

[aniol@westwind geant_cp_e89044]$ paw
 ******************************************************
 *                                                    *
 *            W E L C O M E    to   P A W             *
 *                                                    *
 *       Version 2.14/02       7 February 2003        *
 *                                                    *
 ******************************************************
 Workstation type (?=HELP) <CR>=1 :

(at this point hit enter and you get a graphics screen)
PAW > shell analyze 644 5
 
enter energy and angle
644. 41.20
PAW > exe he3_20
 enter low energy  (<CR>=) 597
 
enter high energy (<CR>=) 612
/NTUPLE/LOOP: Ntuple has only 232292 events. 232292 events processed.
 pkin0 =   609.4136   
 default spectrometer resolutions
    dh         dv        dp
  .300E-03  .100E-02  .100E-03
 change spectrometer resolution? y/n (Normally answer n. This example changes the dp paramter.)
y
 
enter horizontal angle resolution, dh
0.3e-3
 
enter vertical angle resolution, dv
0.1e-2
 
enter momentum resolution, dp
0.1e-2

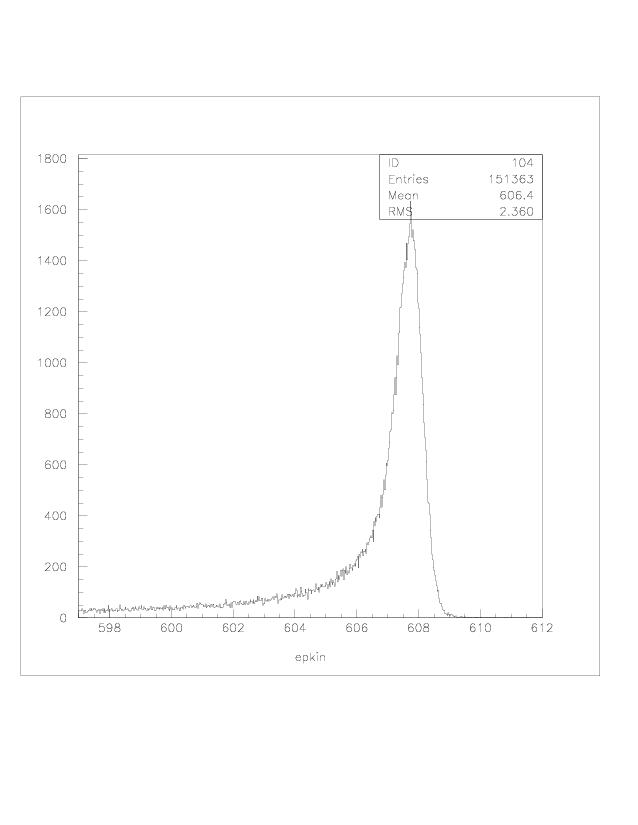
(Paw will generate a spectrum in the higz_01 graphics window)


PAW > hi/pl 104                  (this command will plot histogram # 104)
PAW> shell transfer 644 5 dp0.1e-2               (Note that dp0.1e-2 is the momentum setting you used in the analysis. If you used the default spectrometer resolutions use the suffix 'def'.)
PAW > q                                (this is the quit command to exit paw)

(We can see the files created by paw by doing the ls command)
[aniol@westwind geant_cp_e89044]$ ls *dp0.1e-2.dat
epkin_644_5_dp0.1e-2.dat  pe_644_5_dp0.1e-2.dat    thtg_644_5_dp0.1e-2.dat
epkt_644_5_dp0.1e-2.dat   phtg_644_5_dp0.1e-2.dat  ztgt_644_5_dp0.1e-2.dat

(These are 6 text files containing the the output of the paw analysis. The files labelled epkin* and pe* are 600 lines long and can be read into other progams for further analysis. In addition the epkin..dat file is also copied to geant.dat and geant_in.dat. These two files will be used in the comparison of data to simulation.)

(C) Comparing the geant simulation to the data
We will compare the data to the simulation for q2=5, 644 MeV. We assume that you have summed the data files and produced the data.dat file and paw to produce the geant.dat file. Now run paw++.

[aniol@westwind geant_cp_e89044]$ paw++
in the paw executive pad type
PAW++ [1] exe plotgeant
Enter 597 and 612 twice for the data and the geant spectra limits.
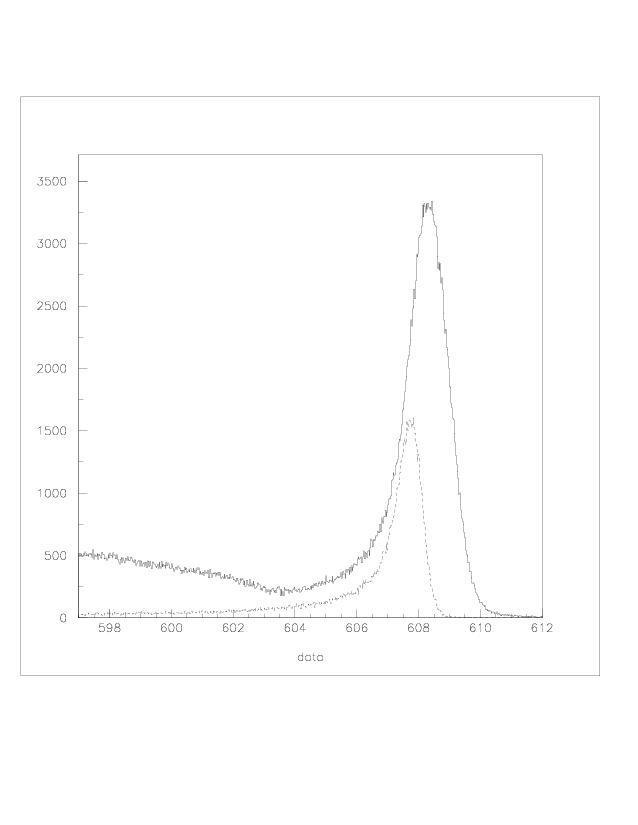
Enter 1 for the normalization. You will get a plot which shows the data and geant on the same graph, as below.

The geant peak is shifted and smaller than the data. In paw++ determine the peak heights in the data (hi/pl 100) and in geant (hi/pl 200).
This will be the scale factor called xnorm to be used later, xnorm = (data height)/(geant height). Also record the peak height location for the data and geant. The energy shift is dele = data - geant. You will need both of these numbers later. They are your first best guess of the scale factor and the energy shift between the data and geant. In this example my readings are:
data peak at 608.3 MeV, data peak height = 3295
geant peak =607.7, geant height = 1580
xnorm = 3295/1580 = 2.09, dele = 608.3 - 607.7 = 0.6 MeV
Record the full width at half maximum of the peaks:
data 607.45 to 609.12 = 1.67 MeV
geant 607.16 to 608.17 = 1.01 MeV
The extra width of the data is due to the effect of the spectrometers. We will smear the geant data with a gaussian to try and match its width to the data.
You are still in paw++. You can edit files from paw or paw++. Type
PAW++ [4] edit gaussit.inp
You will see an input file for a gaussian folding program. This file is setup for our example. You use the vi commands to edit this file.

600
597. 612. 0.75e-3
geant_in.dat
geant.dat

number of channels
elo ehi dp
input data file
output data file

hit the esc key and shift ZZ to get out of the editor
In this case the value of dp is set to 0.75e-3. This is the only number you can change for this q2  and E setting.

Now type

PAW++ [6] shell gaussit.out     this runs a program to broaden the geant peak by an amount given by dp
 
gaussit.out gives an output as below
input file = geant_in.dat       
 output file = geant.dat          
 sumin, sumout   100795.  100795.

run the plotgeant routine again to see how much broadening gaussit has done to the geant data

PAW++ [7] exe plotgeant
PAW++ [9] hi/pl 200       replot the broadened geant data and measure the FWHM now
I get:
geant FHWM 606.72 to 608.42 = 1.7 MeV, which is very close to the data value. If the FWHM were not ok you could edit gaussit.inp and try a different value of dp. This value of dp for the geant spectrum is close enough that we could try to see how good a fit geant gives to the data with the proper shift of energy and scale factor.

Now we edit another input file, fitg.inp, which will tell us how good the fit is.
PAW++ [1] edit fitg.inp
you get the file below
597. 612.   the limits of the spectrum
3.07          the xnorm scale factor
0.75            the shift between the data and geant
606.5 610.5        this is the region to check for geant vs data overlap
3.07         this is the value of xnorm which will be used in the output file fitg.dat
0.75        this is the value of the energy shift which will be used in the output file fitg.dat

emin emax
xnorm
dele0
elo ehi
xnorm2
dele02

esc
shift ZZ
PAW++ [2] shell fitg.out      now run the fitting program. A stream of output on the output pad will appear.
 
delchan  dele  xnorm  chi2/degf
.
.
 29     0.725     3.000     2.626
 29     0.725     3.010     2.613
 29     0.725     3.020     2.612
 29     0.725     3.030     2.625
 29     0.725     3.040     2.649
 29     0.725     3.050     2.686
 29     0.725     3.060     2.735
 29     0.725     3.070     2.796
 29     0.725     3.080     2.869
.
.
Look for the entry with the lowest value in column 4, the chi2/degf column. This is 2.612. The best values for the scale factor and shift are 3.02 and 0.725. Edit the fitg.inp file again to put these values in both places as below:

PAW++ [1] edit fitg.inp
you get the file below
597. 612.   the limits of the spectrum
3.02          the xnorm scale factor
0.725            the shift between the data and geant
606.5 610.5        this is the region to check for geant vs data overlap
3.02         this is the value of xnorm which will be used in the output file fitg.dat
0.725        this is the value of the energy shift which will be used in the output file fitg.dat

emin emax
xnorm
dele0
elo ehi
xnorm2
dele02

run fitg.out again
PAW++ [4] shell fitg.out
PAW++ [5] shell cp fitg.dat geant.dat         copy the best fit to geant.dat
PAW++ [6] exe plotgeant                             run this again to make a post script file of the fit
now for the spectrum limits enter for:
data 597 and 612
geant 597.725 and 612.725              notice that these limits are higher by the best shift value
enter 1 for the normalization.
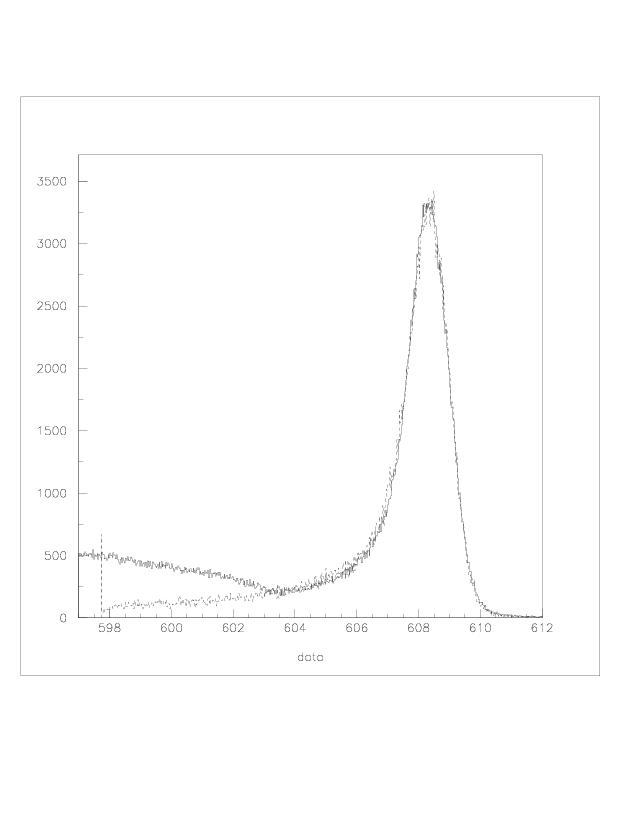
In the graphics screen below we see the geant fit overlapped with the data. In order to save this image file click the right mouse button.


In the pop up window given an identifiable name for the post script file, for example,

data_geant_5_644.ps.

now plot the data spectrum
PAW++[2] hi/pl 100      and get the areas from 606.5 to 610.5 and 610.5 to 612.
data peak: 0.2346e6; data bgd 1136
now plot the geant spectrum
PAW++ [3] hi/pl 300    and get the areas from 606.5 to 610.5 and 610.5 to 612.
geant peak: 0.2377e06; geant bgd 665

and enter these values into the (q2,energy) html data table such as this example.


q2
644
842
1257
1956
2903
4032
1.29
DH, 20.17
(625,640)


1.31

ER, 15.49
(821,836)


1.59
DH, 22.46
(621,636)


1.88
DH, 24.46
(618,633)


1.90

ER, 18.72
(817,832)


2.26
DH, 26.96
(615,630)


2.79


DH, 15.19
(1222,1237)


2.91
DH, 30.77
(611,626)


3.7
DH, 34.97
605,620)


4.56
DH, 39.17
(599,614)


4.99
DH, 41.20
(597,612)


ER, 13.05
(1909,1924)


5.01

ER, 31.03
(797,812)
DH, 20.57
(1207,1222)


10.1

ER, 45.67
(760,775)


11.01


DH, 31.16
(1168,1183)


14.94


ER, 15.37
(2788,2803)

14.98


ER, 36.96
(1141,1156)


15

ER, 57.91
(726,741)


19.06


ER, 42.46
(1113,1128)


19.37


ER, 12.56
(3880,3940)
over 300 channels
19.39

ER, 68.42
(696,711)