HERTZSPRUNG-RUSSELL DIAGRAMS
Ejnar Hertzsprung (1873-1967)
Henry Norris Russell(1877-1957)
(photo courtesy of Yale University)
photo courtesy of Yerkes Observatory, U. of Chicago
Hertzsprung bio. http://www.phys-astro.sonoma.edu/BruceMedalists/BM2H-L.html#32
Russel bio.
http://www.phys-astro.sonoma.edu/BruceMedalists/BM2Q-R.html#20
The HR diagram is of great value in astrophysical research.
In Russell's paper ,
"Relations between Spectra and Other Characterisitics
of Stars",
Popular Astronomy, 22 (1914), 275-294
discussed on page 245 of Crowe's book, Russell was
able to use about 300 stars whose spectral types had been cataloged and
whose distances had been measured by parallax. This was similar to work
that Hertzsprung had done a bit earlier.
In the case of Hertzsprung's work the attempt
to obtain an absolute magnitude scale was done by a statistical technique.
The HR-diagram of a 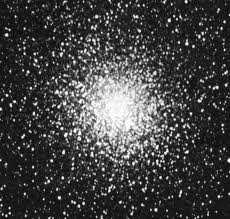 globular cluster, for example M022, will reveal
1) the distance to the cluster
2) the age of the cluster.
3) HR diagram of a globular cluster from GAIA 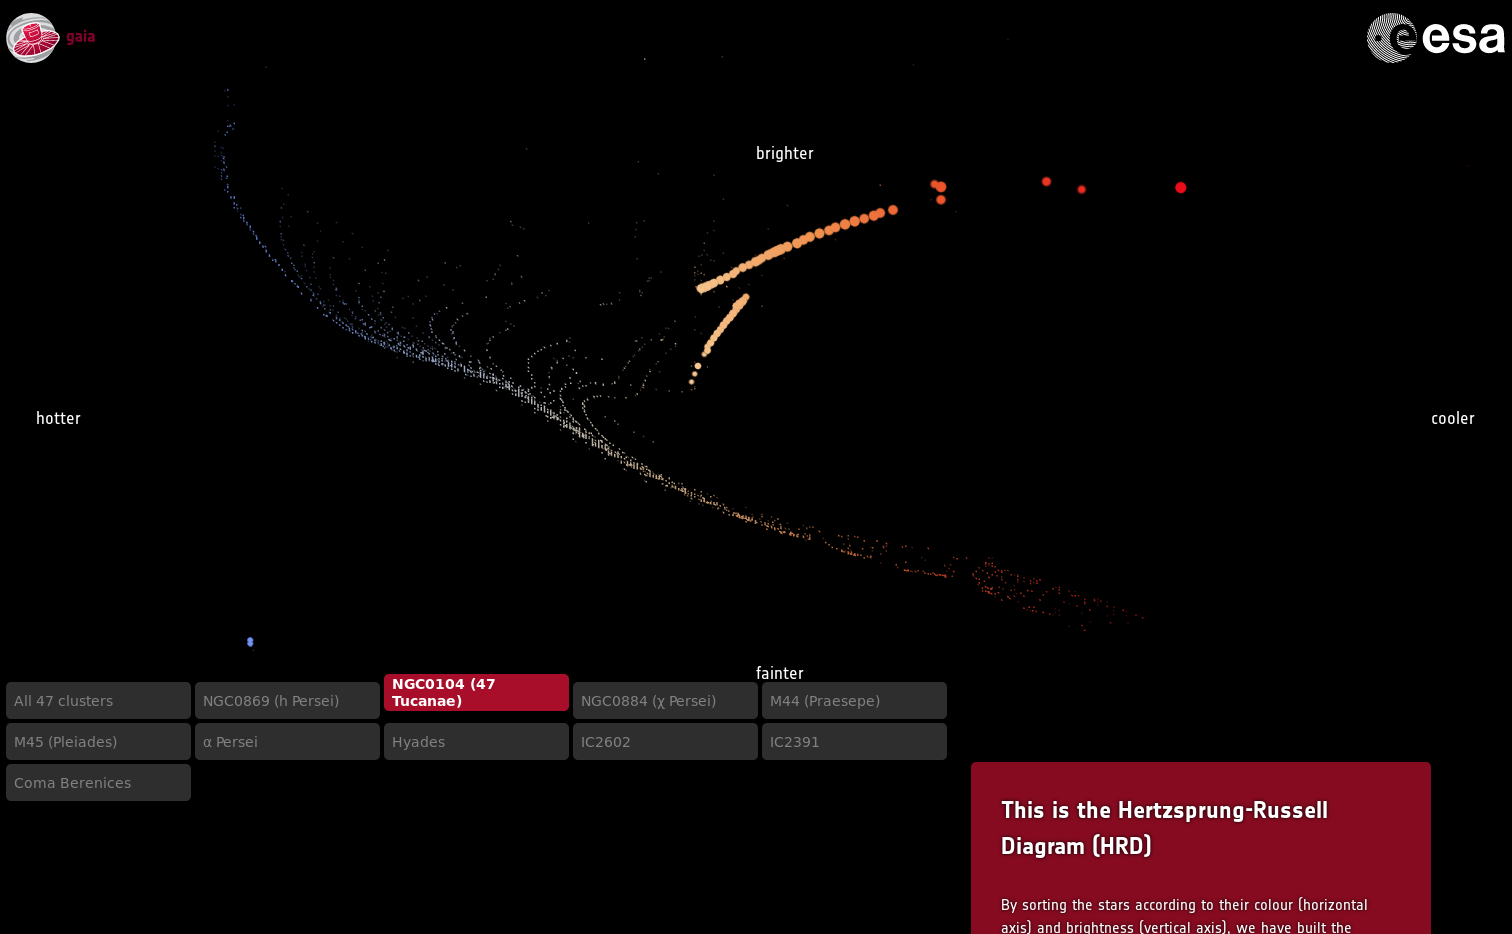
Russell's paper mentions that temperature seems to
be the defining trait that distinguishes the various spectral classes for
most of the stars. This idea was developed in detail by
Cecila Payne-Gaposhkin
. We now know that the energy production in stars is due to nuclear fusion
of lighter isotopes into more massive isotopes. The rate at which fusion
occurs depends on the stellar temperature. The more massive stars have
higher temperatures, consequently the fusion rate is higher in them. Since
these massive stars consume their fuel more quickly than less massive stars,
they reach the end of their life cycle more rapidly. In a group of newly
formed stars, say in a globular cluster that has condensed from a gas cloud,
the stars will start out on the "main sequence", indicated below. Young
massive stars start out with high surface temperatures in the O-B range
( about 30,00K in the stellar atmosphere). As they burn up their nuclear
fuel the physics of the process causes the outer atmospheres to expand
to make a giant atmosphere, which itself is cooler, hence red. The interior
of these "red giants" is still extremely hot. The stars move off the main
sequence into the upper right hand corner of the HR-diagram. Thus, stars
can be reddish in color either because the have small masses, for example,
the red dwarfs, or because the have very large masses which lead to a "cool"
atmosphere red giant.
By studying the shape of the HR-diagram for a given
globular cluster it is possible to determine the age of the cluster. In
the diagram below we see examples of curved paths away from the main sequence.
The older the cluster the lower down in the graph the curved branch begins.
Our sun is a main sequence G2. It has gone through about 1/2( 4.5 billion
years) of its life time on the main sequence .
If all globular clusters were at the same distance
from the earth the vertical scale of visual magnitude would be the same.
Because the distances vary, however, the visual magnitudes will differ.
Two clusters may show the same shape of HR-diagram, which indicates they
are the same age, but the difference in visual magnitude is due to the
1/d2 decrease in light intensity, where d is the distance to
the cluster.
From Kaler's book we find that the distance, d, in parsecs to a star can be determined knowing its
apparent magnitude, m, and its absolute visual magnitude, M.
M is the apparent magnitude if the star were placed at 10pc distance.
M = m + 5 - 5log(d).
This can be used to get the distance to a cluster if we find a G2 star(like our sun)
on the main sequence. The value for M for the sun is +4.83. Hence we can solve for the distance to a cluster
by using the value of m for the G2 star in the cluster in the equation
log(d) = (5 + m -4.83)/5.