
All distances eventually get tied down to stellar parallax. The process is :
1)Measure, trignometrically, the distances to certain stars.
2) Use physical characteristics of stars at a known distance to associate with their luminosities.
examples - cepheid variable stars : These show a periodic and regular variation in their light output as a function of their luminosity
- Stars on the main sequence of the Hertzsprung -Russell diagram. The absolute luminosity depends on the spectral class ( or temperature ).
3) Measure the spectral class or period of a star's luminosity and compare the apparent brightness with the known real brightness ( luminosity ) to obtain the distance from the 1/d2 law describing how the brightness decreases with distance.
Using a star's apparent magnitude, m, and it's absolute magnitude M we can determine it's distandce, d. For our sun it's aboslute magnitude is M = 4.83. This would be it's apparent magnitude, m, if it were placed 10 parsecs away, m = 4.83. Suppose we find a G2 category star of magnitude m on the main sequence in a globular closter. Th distance d to the cluster can be calculated in parsecs(1 pc = 3.28 ly). d = 10(m - 4.83 + 5)/5.
There are many other ways of obtaining distances, but
these two using the cepheid variables and the Hertzsprung -Russell diagram
are the main ones.
Thus, we see as part of the results of the HIPPARCOS
satellite and the aim of the GAIA satellite the location and distance
determination of the cepheid variables in our galaxy.
Measurements of distances across our galaxy and outside
our galaxy were important in determing the nature of the spiral nebulae
to be that of "Island Universes" outside our Milky Way Galaxy and of comparable
stature.
Lick Observatory distance tutorial
Astronomical Distance Ladder, Lick Observatory
Galactic Motions
Motions of galaxies can be of two types,
1) linear motion of the galaxy as a whole
2) internal motion of the galaxy
Just as measuring the positions of the planets enabled ancient and modern astronomers to devise models for the solar system, the measurement of the large scale motions of the galaxies enables us to devise models for the universe. Is the motion within a galaxy random? Do the galaxies move randomly with respect to each other?
The first person to have measured galactic velocities was Vesto M. Slipher of the Lowell Observatory in Flagstaff Arizona in 1912. He found that the Andromeda nebula was approaching the sun ( our galaxy ) at 300 km/s. By 1914 he had recorded 13 Doppler shifts and by 1925 he had measured 45. Measurements of the relative motion of galaxies was important in determining the large scale structure of the observable universe. We have in Crowe's text( p. 256) an excerpt from Slipher's 1915 paper. He also observed a curvature in spectral lines from galaxies. This curvature could be interpreted as a doppler shift of the light coming from different regions of a galaxy.
Adriaan van Maanen's (Mt. Wilson) paper , p. 259 in
Crowe, reports on the internal motion of M101 by a non-spectroscopic technique,
namely, comparing photographs of the galaxy taken many years apart. His
table on p. 263 allows us to calculate , in principle, the internal
mass of M101 as a function of the distance from the center of that galaxy.
The issue here is whether or not his data are reliable.
Harlow Shapely and the distance scales at Mt. Wilson, 1918
Determining Distances to Globular Clusters 1
Determining Distances to Globular Clusters 2
Determining Distances to Cepheid Variables
Exercise in Class
From Hubble's paper (p. 332 Crowe) on M33
and Henrietta Leavitt's paper on the
( p. 230, Crowe) we can determine the relative distances
between them. We do this by noting that magnitudes differ so that
a difference in 5 units of magnitude is equal to a factor of 100 in brightness
( the energy per unit area/second from the object).

Small Magellanic Cloud |
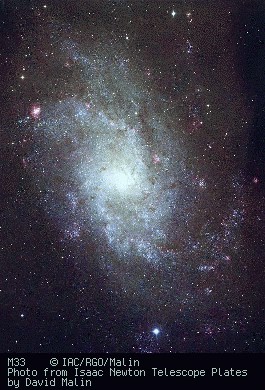
M33 - Triangulum Galaxy |
Thus, B1/B2 = 2.51189(m2
- m1) , where m2 and m1 are the magnitudes of objects 2 and 1 and
the B's refer to their brightness. The constant term is the fifth root
of 100, that is,
2.51189 = 1001/5 .
1)
Leavitt's and Hubble's data Graph
Plot both Hubble's data and Leavitt's data on the
same graph with the vertical axis representing photographic magnitude (
from 11 at the top to 20 at the bottom) and the horizontal axis representing
log(period) from 0 to 3.0 . Use the maximum value of the magnitude for
the vertical scale. Expand the horizontal scale so that you use up as much
of the graph as possible.
2) Draw straight lines by eye through the data sets. For the middle of Hubble's data obtain the difference in magnitude between his data on M33 and Leavitt's on the SMC. Using the formula above find the ratio of brightness, calling the SMC object 1 and M33 object 2.
3) We now can use the brightness ratio to obtain the absolute brightness ratio of the cepheid variables in the two objects. We know that the brightness falls off as 1/distance2 .
(D2 / D1 )2 = B1 /B2 . Using the value of D1 = 0.21 Mly for the SMC, find the distance to M33. How does this compare to the value reported in SEDS' Messier catalog?
Hubble's 1929 paper (http://antwrp.gsfc.nasa.gov/diamond_jubilee/1996/hub_1929.html) on the velocities of nearby galaxies - The beginning of the "Expanding Universe".
For a collection of informative debates on the issues
of cosmology and astrophysics see
The
Great Debate, and more!
references
"Exploration of the Universe", George Abell, Holt
Rinehar,Winston Inc., 1969
"Astronomy!: A Brief Edition", James B. Kaler, Addison-Wesley, 1996
"Modern Theories of the Universe from Herschel to Hubble", Michael J. Crowe, Dover Pub., 1994
"The Norton History of Astronomy and Cosmology", John
North, W.W.Norton & Co. ,1994